Are you sure your surfaces are clean?

The effectiveness of your sanitation system can easily be checked using readily available ATP sanitation monitoring systems. But, while these systems are the current ‘gold standard’ for monitoring hygiene program effectiveness in food and beverage production facilities, how can you be sure that your system is delivering reliable and accurate results?
ATP systems provide an easy and quick measure of a facility's cleanliness by measuring levels of ATP (adenosine triphosphate), a chemical found in every living cell. ATP hygiene monitoring systems determine cleaning effectiveness by measuring the reduction (or removal) of ATP on food contact surfaces. The method has been used in the food production industry for over 20 years and can easily be customised for the specific equipment, people, product and processes used in any food production facility. The system enables users to set an objective, recordable and traceable standard to help avoid the costly consequences of substandard cleaning efforts.
Real-world comparison of commercially available hygiene monitoring systems
The Applied Research Centre at NSF International has conducted a comparison performance study examining the performance of five commercially available ATP-based hygiene monitoring systems.
The results were clear with Julie Vantine, project manager at NSF International, concluding, “Neogen's AccuPoint Advanced ATP system consistently yielded the highest percent recoveries and the most consistent readings of the target analytes, when compared to the other four test systems."
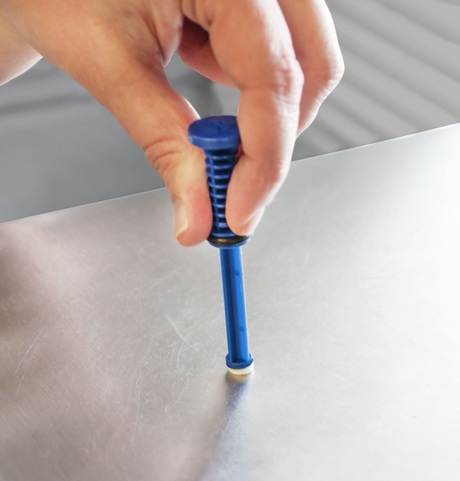
The Neogen AccuPoint Advanced hygiene monitoring system offers state-of-the-art samplers, a simple and accurate reader and data manager software to effectively detect adenosine triphosphate (ATP) from food residues and microorganisms present on surfaces and in liquids. The robust handheld AccuPoint Advanced reader can be used to test virtually anywhere and produces results in less than 20 s. In addition, the system comes complete with user-friendly data manager software that allows the user to create test plans to track, analyse and trend test results over time.
The performance study attempted to mirror typical field usage, looking at how each system recovered both ATP standards and commodities (in this case, orange juice) from a common surface (stainless steel).
A comparative evaluation of the ability of five commercial ATP monitoring systems to accurately report ATP levels from stainless steel surfaces was performed.
Evaluations of the sanitation systems were conducted in four protocols. The studies examined the difference in recovery of ATP standards when applied in a homogenous manner across the carrier as well as to a random spot contamination. The study also assessed the ability of the five ATP monitoring systems to detect a standard commodity food, orange juice, which was applied to carriers in varying concentrations.
Protocol 1
The RLU (relative light unit) outputs for the five test systems were observed when ATP standards were directly introduced onto the swabs/sample pads. The mean RLU output was calculated for 25 replicates and reported in Table 1.
| Reader/sampler |
Neogen AccuPoint 3.04/ AccuPoint Advanced |
System A | System B | System C | System D |
|---|---|---|---|---|---|
| Mean RLU | 593.32 | 871.56 | 206.64 | 29,809.04 | 594.12 |
Homogenously contaminated stainless steel
Stainless steel coupons were prepared with the 100 femtomoles of ATP and then the surface was sampled using each monitoring system's operational instructions. A real-world approach to the exposure time of the swab contact on the sample surface was employed with a standard run/return pattern used over the sample coupon on two axes. Each axis had the timed exposure of swab to surface of 5 s making the entire exposure 10 s. This time frame is relevant to compare the results of a lab study to a real-world, situational use of the monitoring system. The percent of ATP recovered was determined by comparing the mean response from the surface recovery to the mean response of direct swab inoculation observed in Protocol 1.
| Reader/sampler |
Neogen AccuPoint 3.04/ AccuPoint Advanced |
System A | System B | System C | System D | |
|---|---|---|---|---|---|---|
| Mean RLU recovered from surface | Average | 165.2 | 62.8 | 31.1 | 8618.10 | 123.7 |
| Std dev | 34.87 | 20.08 | 18.62 | 5236.99 | 47.34 | |
| %CV | 21.11% | 31.98% | 59.86% | 60.77% | 38.27% | |
| % ATP recovery from surface | Average | 27.84% | 7.21% | 15.05% | 28.91% | 20.82% |
Assessing ATP recovery efficiency
ATP recovery efficiencies were assessed by swabbing stainless steel coupons that had a random spot of 5.0 nM ATP solution (100 femtomoles) dried on it. The surfaces of 10 replicant coupons were sampled utilising the real-world situational sampling method utilising each of the five monitoring systems to determine the mean response of each unit.

The percentage recovery was calculated by comparing the mean response from the surface spot recovery to the mean response of direct swab inoculation observed in Protocol 1. The Neogen AccuPoint Advanced system had the highest percentage recovery of all five monitoring systems at 40.50% recovery of the ATP solution from the unit surface. This represents a two-fold greater percent ATP recovery than the next most efficient monitoring system. The Neogen AccuPoint system also exhibited the greatest consistency in readings (with a CV of 21.11%), indicating that the system is very precise.

Mimicking real-world contamination scenarios
The final study involved contaminating stainless steel surfaces with orange juice at 3 dilutions: 1:1000, 1:5000 and 1:10,000. RLU reference values for each dilution were first generated by direct inoculation onto the ATP monitoring system swabs. Recovery sampling using a real-world approach, as previously described, was performed on homogenously inoculated stainless steel surfaces. The percentage recovered from each surface was determined by comparing the RLU of the surface reading with the RLUs observed from direct swab inoculation.
Once again, the Neogen AccuPoint Advanced had the highest observed percentage recovery of all five monitoring systems. For each of the orange juice dilutions evaluated, the percent recovery of ATP by the Neogen AccuPoint Advanced was significantly higher than that of the other four ATP monitoring systems evaluated. Once again, the Neogen AccuPoint system proved to be the most consistent of the devices evaluated (with a CV of 40.58%).
Recovery of ATP from stainless steel surfaces inoculated with varying concentrations of orange juice.
Samplers |
Orange juice dilution |
Neogen AP Advanced |
System A |
System B | System C | System D |
|---|---|---|---|---|---|---|
| Average | 1:1000 | 1783.4 | 3629.1 | 639.6 | 145,735.9 | 2071.9 |
| Average | 1:5000 | 418.5 | 832.6 | 165.6 | 34,517.6 | 582.4 |
| Average | 1:10,000 | 90.7 | 217.5 | 34.0 | 6394.1 | 139.9 |
| Samplers | Orange juice dilution | Neogen AP Advanced | System A | System B | System C | System D |
| Average | 1:1000 | 553.3 | 71.4 | 65.7 | 14,468.30 | 271 |
| % ATP recovery | 31.03% | 1.97% | 10.27% | 9.93% | 13.08% | |
| % CV | 33.1% | 74.3% | 37.2% | 47.6% | 55.3% | |
| Average | 1:5000 | 119.8 | 48.2 | 27.9 | 2115.40 | 148.1 |
| % ATP recovery | 28.63% | 5.79% | 16.85% | 6.13% | 25.43% | |
| % CV | 46.7% | 32.0% | 43.3% | 36.5% | 38.8% | |
| Average | 1:10,000 | 14 | 26.6 | 0 | 14.4 | 10.5 |
| % ATP recovery | 15.44% | 12.23% | 0.00% | 0.23% | 7.51% | |
| % CV | 146.7 | 111.52 | NA | 316.2 | 31.2 | |
Conclusion
In conclusion, across all real-world test simulations, the larger sampler size of AccuPoint Advanced assisted the unit to be more consistent and accurate in its detection of the amount of ATP on a surface.
In a production environment, more accurate and consistent results mean more reliable data. This data can be used to make critical decisions such as whether to continue with a subsequent production run or delay that production until a second clean can be performed. Reliable information can also result in the prevention of costly product recalls due to undiscovered contamination issues.

Smart optical sensor detects ripeness for a quality drop
Queen Mary University of London researchers are developing a handheld, AI-powered grape ripeness...
Lighting up wine spoilage in real time with novel biosensor
A biosensor that glows when acetic acid is detected has been built by researchers to help...
Novel food processing technologies retain more nutrients in food
The potential of a range of modern techniques to improve the nutritional profiles of grain-,...


